HardwareExporterWindows
Prometheus exporter for Windows hardware metrics using LibreHardwareMonitor, with a ready-to-use Grafana dashboard. [![Open-Source Software][oss]](https://github.com/naughtyGitCat/HardwareExporterWindows)
HardwareExporterWindows
![]()


A Prometheus exporter for Windows hardware metrics using LibreHardwareMonitor.
Grafana Dashboard
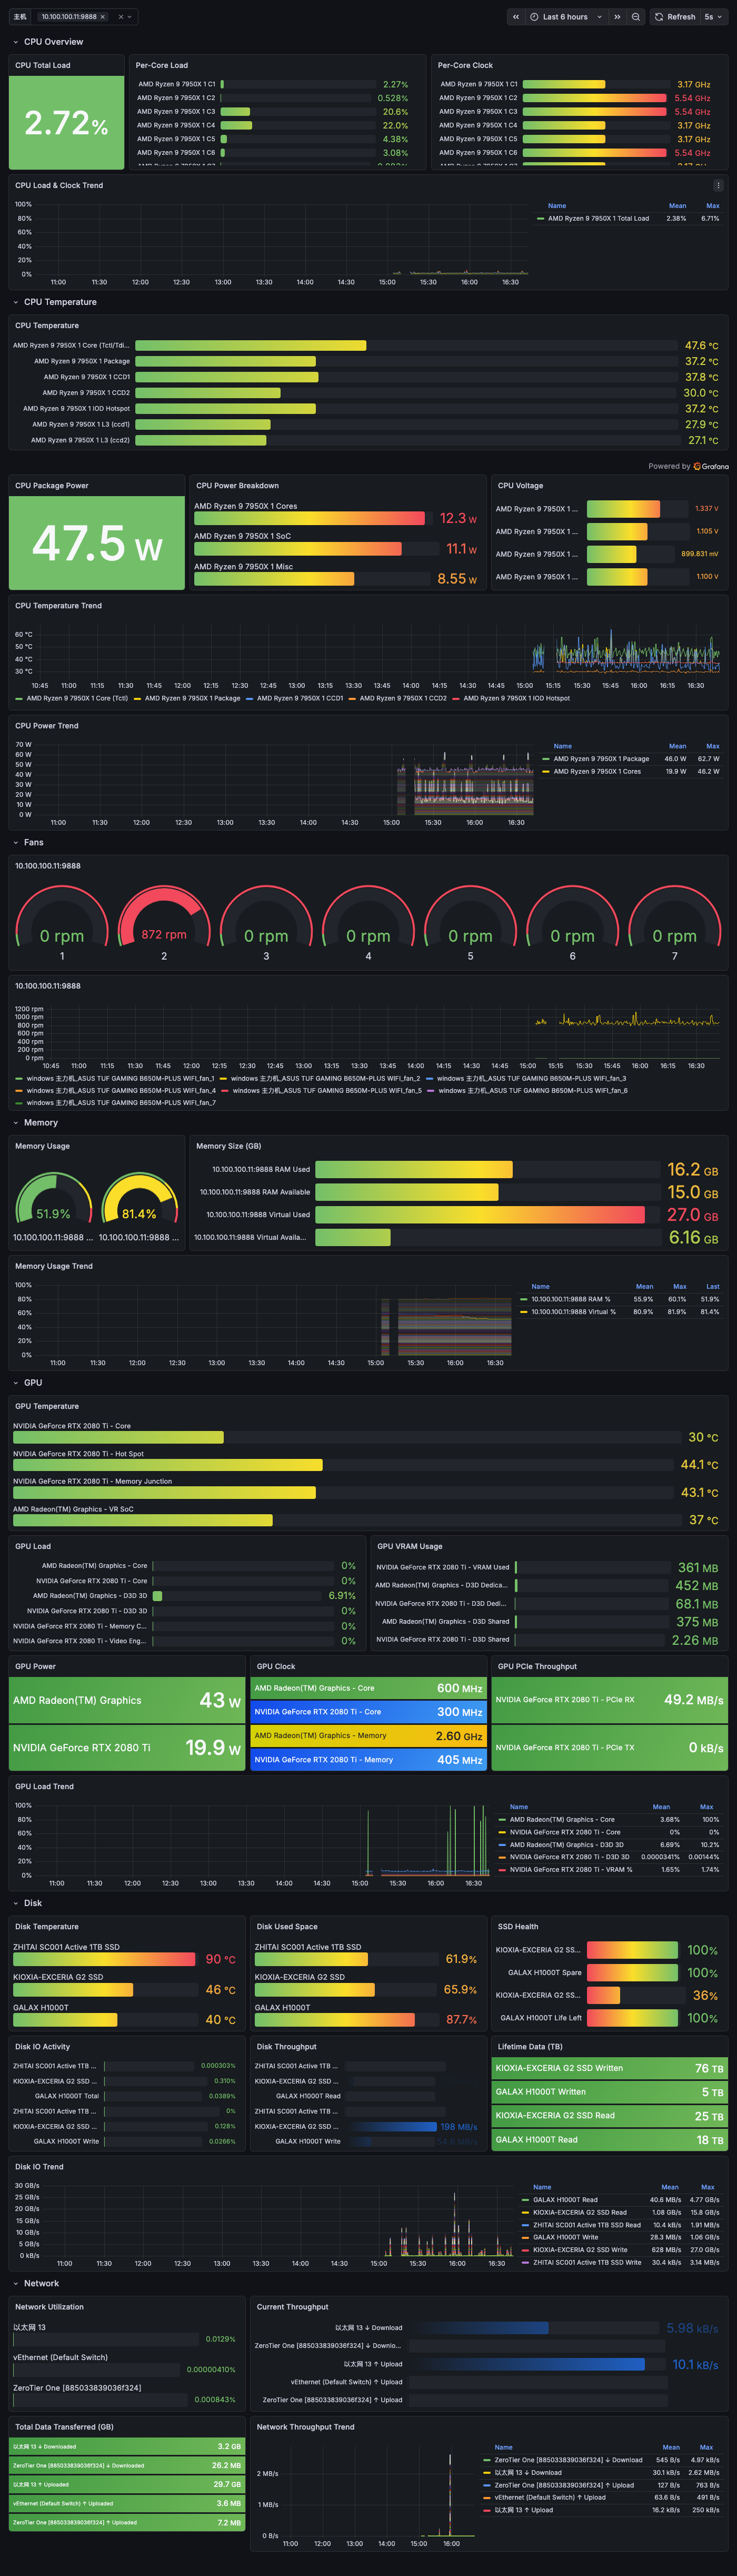
A ready-to-use Grafana dashboard is included at docs/grafana-dashboard.json. Import it via Grafana UI (Dashboards > Import > Upload JSON file).
Dashboard sections: CPU Overview, CPU Temperature, CPU Power & Voltage, Fans, Memory, GPU (Temperature / Load / VRAM / Power / Clock / PCIe), Disk (Temperature / Space / Health / IO / Throughput), Network (Utilization / Throughput / Data Transferred).
Why
windows_exporter's thermal zone data is not accurate
This exporter provides accurate hardware monitoring data by using LibreHardwareMonitor library directly.
Features
- ✅ Accurate CPU, GPU, Memory, Motherboard, Network, and Storage metrics
- ✅ Runs as Windows Service
- ✅ Configurable hardware monitoring (enable/disable specific components)
- ✅ Prometheus-compatible metrics format
- ✅ Low resource usage with singleton pattern
- ✅ Structured logging
Installation
Prerequisites
- Windows 10/11 or Windows Server 2016+
- .NET 10.0 Runtime (or SDK for development)
- Administrator privileges (required for hardware access)
Quick Start
Option 1: MSI Installer (Recommended)
- Download
HardwareExporterWindows-win-x64.msifrom the latest release - Double-click the MSI file to install
- The installer will automatically:
- Copy files to
C:\Program Files\HardwareExporter - Install and start the Windows Service
- Configure firewall rules
- Copy files to
Option 2: Manual Installation with PowerShell Script
- Download
HardwareExporterWindows-win-x64.zipfrom the latest release - Extract to
C:\Program Files\HardwareExporter - Run PowerShell as Administrator
- Execute the installation script:
cd "C:\Program Files\HardwareExporter"
.\install.ps1
The script will:
- Copy files to the installation directory
- Create a Windows Firewall rule
- Register and start the Windows Service
Manual Installation
# Register as Windows Service
New-Service -Name "HardwareExporter" `
    -BinaryPathName "C:\Program Files\HardwareExporter\HardwareExporterWindows.exe" `
    -StartupType "Automatic" `
    -Description "Hardware Exporter Service"

# Start the service
Start-Service -Name "HardwareExporter"
Configuration
Edit appsettings.json to customize the exporter:
{
  "HardwareMonitor": {
    "EnableCpu": true,
    "EnableGpu": true,
    "EnableMemory": true,
    "EnableMotherboard": true,
    "EnableController": true,
    "EnableNetwork": true,
    "EnableStorage": true,
    "ScrapeIntervalSeconds": 15
  },
  "Urls": "http://0.0.0.0:9888"
}
Configuration Options
| Option | Type | Default | Description |
|---|---|---|---|
EnableCpu |
bool | true | Monitor CPU metrics |
EnableGpu |
bool | true | Monitor GPU metrics |
EnableMemory |
bool | true | Monitor Memory metrics |
EnableMotherboard |
bool | true | Monitor Motherboard metrics |
EnableController |
bool | true | Monitor Controller metrics |
EnableNetwork |
bool | true | Monitor Network metrics |
EnableStorage |
bool | true | Monitor Storage metrics |
ScrapeIntervalSeconds |
int | 15 | Update interval (not used yet) |
Prometheus Configuration
Add this to your prometheus.yml:
scrape_configs:
  - job_name: 'windows-hardware'
    static_configs:
      - targets:
          - '192.168.1.100:9888'  # Your Windows machine IP
          - '192.168.1.101:9888'
HardwareExporterWeb (Optional Service Discovery)
HardwareExporterWeb is an optional companion service that provides automatic service discovery for Prometheus. It is not related to metrics collection - it only helps Prometheus automatically discover monitoring targets on your network.
What It Does
- Automatically scans your local network to discover Windows machines running HardwareExporter
- Provides Prometheus HTTP Service Discovery endpoints
- Eliminates the need to manually configure each target in
prometheus.yml
Installation
Download HardwareExporterWeb-win-x64.zip from the latest release and run it on any machine in your network (doesn't need to be on every monitored machine).
Configuration
Edit appsettings.json:
{
  "NetworkScan": {
    "SubnetFilter": "",           // Empty = scan all local subnets
    "SubnetMask": "255.255.255.0" // Subnet mask
  }
}
Prometheus Configuration with Service Discovery
Instead of static targets, use HTTP service discovery:
scrape_configs:
  - job_name: 'windows-hardware-auto'
    http_sd_configs:
      - url: 'http://your-web-server/api/ServiceDiscovery/HardwareExporter'
        refresh_interval: 60s
API Endpoints
/api/ServiceDiscovery/HardwareExporter- Discover HardwareExporter instances/api/ServiceDiscovery/WindowsExporter- Discover windows_exporter instances
Note: This is completely optional. You can use static configuration in prometheus.yml if you prefer.
Available Metrics
The exporter provides two types of metrics:
- Hardware Metrics - From LibreHardwareMonitor
- .NET Runtime Metrics - From prometheus-net (GC, threads, memory, etc.)
All metrics are available at the /metrics endpoint.
Hardware Metrics Format
hardware_{type}_{sensor_type}_{sensor_name}{labels} value
Example Metrics
# CPU Temperature
hardware_cpu_temperature_core{name="AMD Ryzen 9 5900X", core="0"} 45.0

# GPU Usage
hardware_gpu_load_core{name="NVIDIA GeForce RTX 3080", vendor="nvidia"} 75.5

# Memory Usage
hardware_memory_load_memory{name="Generic Memory"} 45.2

# Fan Speed
hardware_motherboard_fan_fan{name="ASUS ROG STRIX B550-F", fan="1"} 1200
Metric Types
temperature- Temperature in Celsiusload- Load percentage (0-100)clock- Clock speed in MHzpower- Power consumption in Wattsfan- Fan speed in RPMvoltage- Voltage in Voltsdata- Data rate in GB/sthroughput- Throughput in MB/s
Troubleshooting
Service won't start
- Check Windows Event Viewer for errors
- Ensure you have Administrator privileges
- Verify .NET 10.0 Runtime is installed
- Check if port 9888 is already in use
No metrics appearing
- Check if the service is running:
Get-Service HardwareExporter - Test the endpoint:
curl http://localhost:9888/metrics - Check logs in Event Viewer under "Application"
Firewall issues
The installation script creates a firewall rule automatically. If needed, create it manually:
New-NetFirewallRule -DisplayName "HardwareExporter" `
    -Direction Inbound `
    -Program "C:\Program Files\HardwareExporter\HardwareExporterWindows.exe" `
    -Action Allow
Development
Building from Source
git clone https://github.com/naughtyGitCat/HardwareExporterWindows.git
cd HardwareExporterWindows
dotnet build
Running in Development
cd src/HardwareExporterWindows
dotnet run
Access metrics at: http://localhost:9888/metrics
Running Tests
dotnet test
Credits
- LibreHardwareMonitor - Hardware monitoring library
- prometheus-net - Prometheus client library
License
MIT License - see LICENSE file for details.
This project uses the following open source libraries:
- LibreHardwareMonitor (MPL 2.0)
- prometheus-net (MIT)
Contributing
Contributions are welcome! Please feel free to submit a Pull Request.